Cann Group senior corporate communications manager Rhys Cohen examines the TGA's new Authorised Prescriber dashboard and arrives at one clear conclusion — Australia's medicinal cannabis industry is growing fast.
The Therapeutic Goods Administration has published a medicinal cannabis Authorised Prescriber data dashboard, offering fresh visibility into how patients are accessing treatment in Australia. The dashboard records 292,033 "new patients initiated on treatment" and 527,614 "total patients treated" since 2016.
Those numbers, however, are not straightforward. Understanding what they actually mean requires a close look at how the data is gathered and reported — which takes some careful unpacking.
First, it helps to revisit the November 2021 changes to patient access processes and the five medicinal cannabis product "categories" introduced at that time. If you're already across this, feel free to skip to the next section.
How medicinal cannabis product categories work
Before November 2021, doctors who wanted to prescribe medicinal cannabis had to either obtain a SAS-B approval or qualify as an Authorised Prescriber (AP). SAS-B approvals were tied to a specific product, a specific patient, and a specific medical indication. That meant prescribing a different product to the same patient for the same condition required an entirely separate SAS-B approval. Since an approval had to be in place before any prescription could be filled, this created a significant ongoing administrative burden.
Becoming an AP was appealing by comparison. AP status allowed a doctor to prescribe a particular product to an approved class of patients — for example, adults — under their direct care, for a specified condition, without seeking individual TGA approval for each person.
Rather than generating paperwork for every product-patient-indication combination the way SAS-B required, APs only needed to submit a report to the TGA twice a year detailing how many patients they had treated in the preceding six months. The catch was that if a product went out of stock — which was, and remains, common — or a doctor wanted to prescribe something newly available, they still had to fall back on the SAS-B pathway.
The initial cost and effort of becoming an AP was higher, but ongoing administration was lighter. Doctors seeking AP status needed endorsement from a Human Research Ethics Committee (HREC). While HRECs are not scarce, very few were willing to endorse medicinal cannabis prescribers. Most APs obtained their endorsement through the HREC at the National Institute of Integrative Medicine, at a cost of A$800 per application, with processing times of at least eight weeks depending on the committee's meeting schedule.
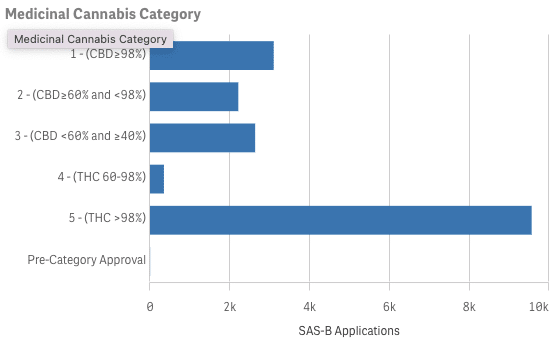
The TGA concluded that this product-specific framework placed excessive administrative demands on prescribers, and in November 2021, the system was overhauled. Rather than tying SAS-B and AP approvals to individual products, the TGA grouped all medicinal cannabis products into five categories based on relative THC/CBD content:
- Category 1: at least 98% CBD
- Category 2: less than 98% and more than 60% CBD
- Category 3: less than 60% and more than 40% CBD
- Category 4: between 60% and 98% THC
- Category 5: more than 98% THC
From November 2021, approvals applied to product categories and formats (such as oil or flower) rather than to individual products. An AP could therefore prescribe any product within their authorised categories and formats without needing separate approval each time a new product entered the market.
For instance, an AP authorised to prescribe category 1 oil products for chronic pain could immediately prescribe any newly listed category 1 oil without additional paperwork. This made the AP pathway considerably more practical and appealing.
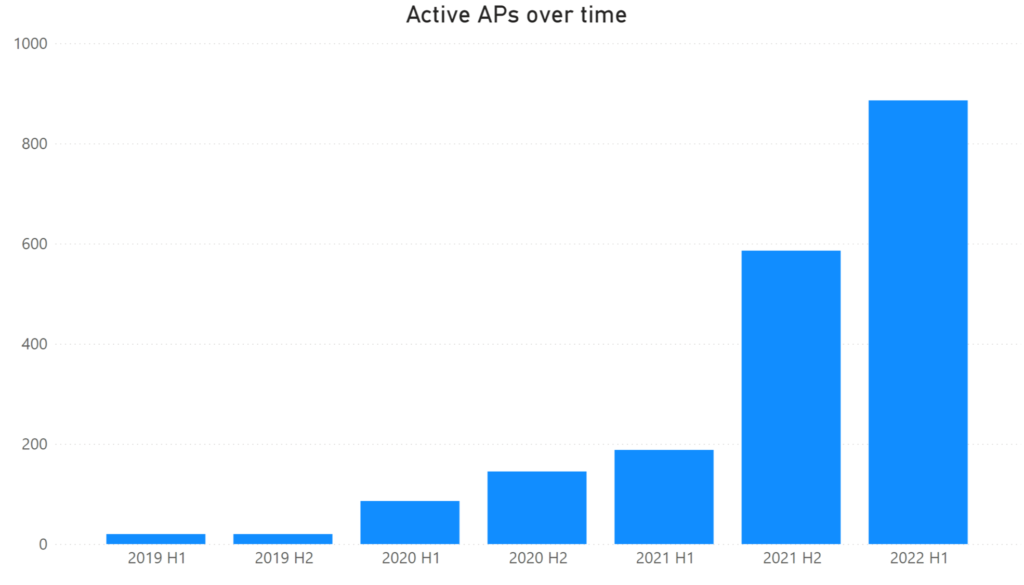
The TGA also created a faster, cheaper route to AP status for certain lower-risk treatments. Oil or capsule products used to treat adults for either chronic non-cancer pain (in categories 1, 2, or 3) or anxiety (in categories 1 or 2) were deemed to have an "established history of use." Doctors seeking AP status for these products no longer needed HREC endorsement — they could apply directly to the TGA, receive approval within days, and pay nothing. The number of doctors using the AP pathway surged as a result, climbing from under 200 in the first half of 2021 to nearly 600 in the second half of that year, and almost 900 in the first half of 2022:
How APs report the number of "patients treated"
Consider how AP reporting actually works under the post-November 2021 rules. Take a scenario: a patient — call her Susan — consults an AP named Dr Carter in January 2022. Dr Carter writes Susan prescriptions for the following products:
- One CBD isolate oil (category 1)
- One CBD broad spectrum oil (category 1)
- One balanced oil (category 3)
- One balanced capsule (category 3)
- Four different high-THC dried-flower products (category 5)
When Dr Carter files her six-monthly report to the TGA in June 2022, she should record "total patients treated" as four — even though she prescribed eight different products across three categories and three formats to a single patient.
This is because "total patients treated" counts the number of patients an AP has treated with a product:
a) From a specific product format, and
b) from a specific medicinal cannabis product category.
For Susan, the calculation would look something like this:
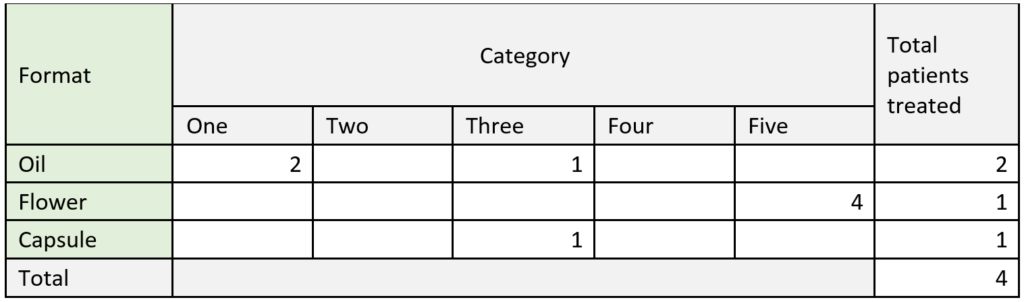
(This is not the format in which APs are required to report to the TGA, it's just easier to explain it this way. If you want to see how the AP reporting system actually looks, that's available here).
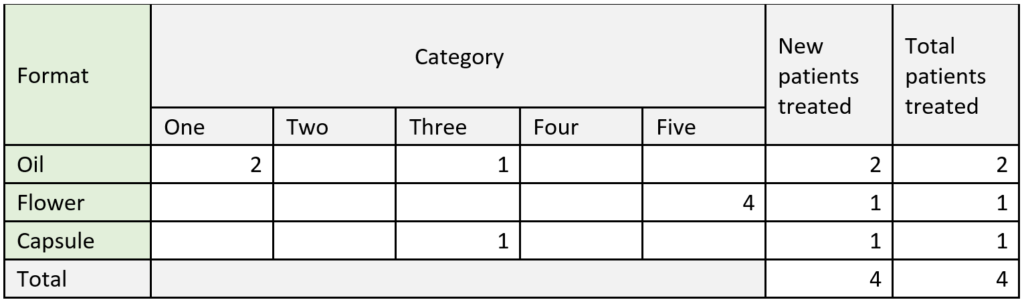
APs are also required to identify which of those "patients treated" are new. In this example, Susan is visiting Dr Carter for the first time in January 2022, so when Dr Carter submits her report in June 2022, all of Susan's treatments are new. Dr Carter would report "total patients treated" as four and separately report "new patients treated" as four, which would look something like this:
Now suppose Susan returns for a follow-up with Dr Carter in September 2022. She has used all her previous prescriptions, and Dr Carter writes new scripts for the same products — except one of the flower products has been discontinued, so she substitutes a different category 5 flower product instead.
When Dr Carter files her six-monthly report in December 2022, she would again report "total patients treated" as four. Since Susan has already been prescribed products from the same categories and formats, "new patients treated" would be zero.
The same applies if Susan is still taking her medicinal cannabis but doesn't need new prescriptions yet. Dr Carter should include Susan in "total patients treated" for the entire duration of her treatment, not only when new scripts are written.
This is where the system becomes complicated. The following year, Susan returns and reports that some of her products are less effective than before. Dr Carter decides the two CBD oils should be replaced with something containing slightly more THC.
Dr Carter writes new prescriptions for the same flower, capsule, and balanced oil Susan had been taking, but replaces the CBD isolate and CBD broad spectrum oils with a single 20:1 CBD:THC oil, which falls under category 2. The calculation for this reporting period would look something like this:
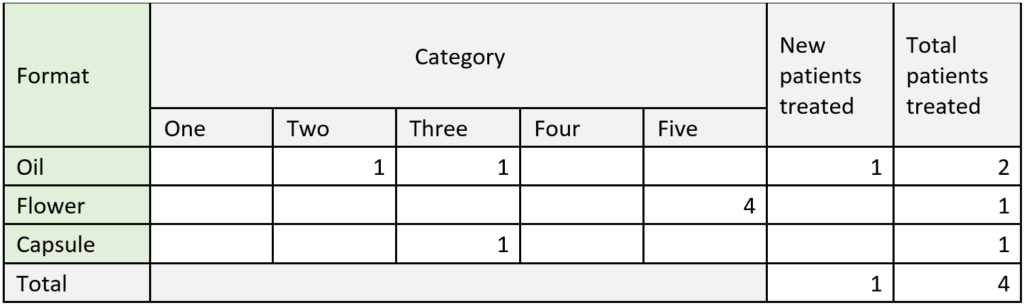
So even though Dr Carter has been treating Susan with medicinal cannabis for over a year, prescribing a product from a new category/format combination for the first time causes Susan to appear as a "new patient treated" in the AP data.
Problems with the AP data
If the above explanation felt hard to follow, consider how it must feel to a busy practitioner. Why should Dr Carter record four "total patients treated" when she is only treating Susan? And if she has been treating Susan for more than a year, how does it make sense to count her as a "new patient"? The logic is anything but intuitive.
Being an AP requires Dr Carter not only to understand these distinctions, but to maintain accurate records of how Susan's prescriptions should be categorised in TGA reports. Picture Dr Carter two years down the track, wanting to prescribe Susan a new product and having to trawl through years of prescribing records just to determine whether the prescription counts as a "new" patient event. Now multiply that across all the medicinal cannabis patients a typical AP — or a doctor working in a cannabis-focused clinic — might have. And consider: would it even be noticed if Dr Carter made an error?
Looking at the AP data portal reveals some clear anomalies. Between January and June 2021, "new patients initiated on treatment" was recorded as 119,285 while "total patients treated" was 112,334. It is not mathematically possible for total patients to be lower than new patients in the same period.
When this question was put to the TGA, a spokesperson replied:
"Please be advised that the TGA has no control on these figures as they represent the self-reported numbers submitted by the Authorised Prescriber for the reporting period as a part of their AP six-monthly reporting obligation.
However, during compliance checks, if it comes to our attention that the submitted numbers do not appear accurate, for example, as you have indicated, the reported number of new patients initiated on treatment is greater than the total number of patients treated, an educational email will be sent out to the Authorised Prescriber on the correct method for patient reporting."
The accuracy and completeness of the TGA's AP data is therefore genuinely uncertain. If an AP should have reported 1,000 "new" and 2,000 "total" patients but submitted five "new" and 10 "total," it would go undetected. Only if they reported 10 "new" and five "total" might they receive an "educational email" from the TGA.
Beyond reporting errors, the AP data carries other structural weaknesses: a patient may receive prescriptions for eight products but fill only some — or none; a patient may see two different APs in the same six-month window and appear in the data twice; a patient may see a doctor who prescribes some products under their AP authorisation and others via SAS-B, showing up in both datasets; or a patient may hold a script with 10 repeats and not require a new one for a year or more, effectively vanishing from the data.
The phrase "garbage in, garbage out" seems apt. That said, the data is what it is, and despite its limitations, there are still meaningful observations to be drawn from it.
AP data trends by category
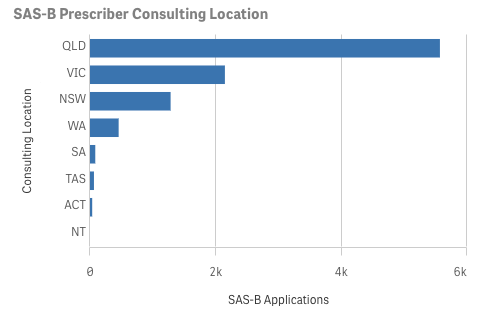
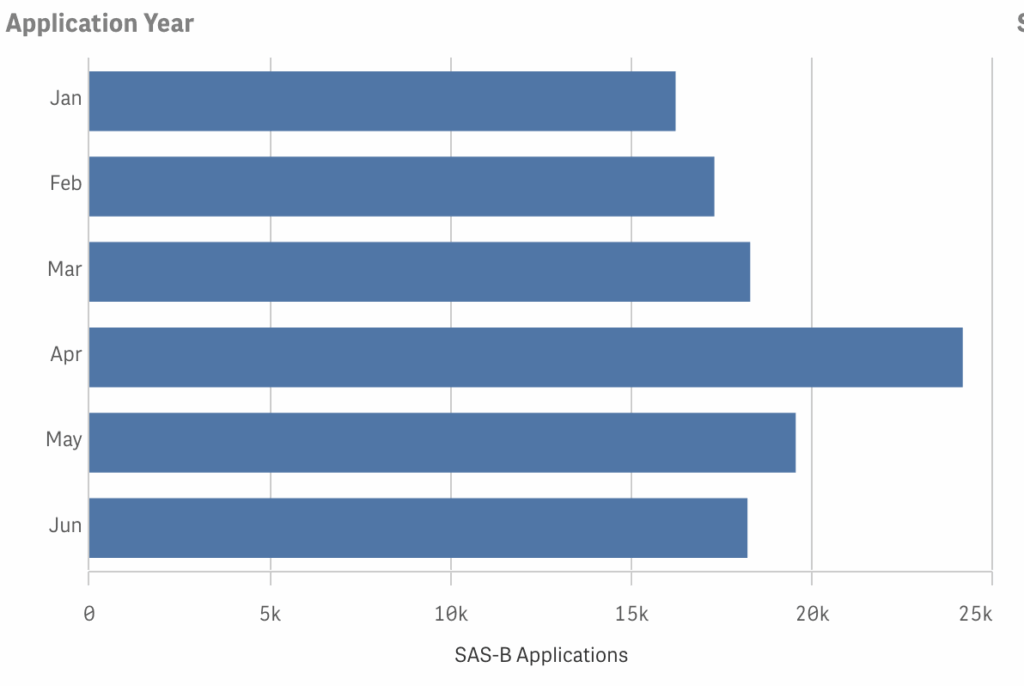
The November 2021 reforms appear to have pushed prescribers away from the SAS-B pathway and toward the AP pathway. One consequence of this shift is that SAS-B data is considerably richer than AP data. Each SAS-B approval carries information about the month it was issued, the patient's gender and age, the product format, and the medical indication.
For AP "patients," only the six-month reporting period and product category are known. There is no data on gender, age, product format, or medical indication. So when examining AP data, the options are limited to comparing "new" versus "total" patients — which is too unreliable to be useful, at least at this stage — or looking at trends across product categories.
Even the category data is complicated by the November 2021 transition. APs who became authorised after that date automatically fall under the new system, but some older APs have not yet transitioned. For patients treated under the new system, the product category is recorded. For those treated under the pre-category system, it is not.
Looking at "total patients" alone, from July to December 2021, 76% of treatments occurred under the old pre-category system. From January to June 2022, that proportion dropped to 18%, while the share of category 5 "patients" grew from 7% to 29%.
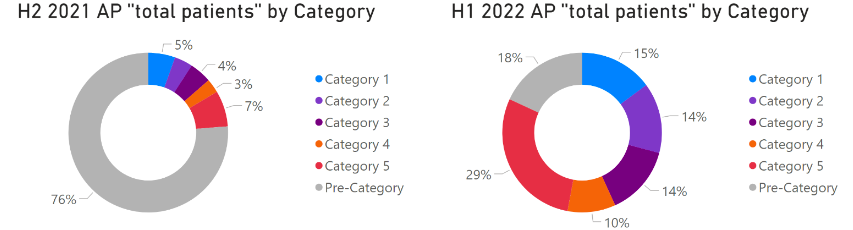
Keep in mind that for most of H2 2021, the category system did not yet exist. To identify any genuine trends in how categories are growing relative to one another, the pre-category data needs to be removed. When that is done, the picture changes considerably.
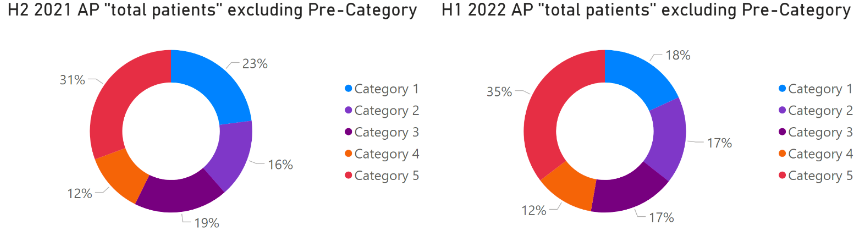
This comparison should be treated with caution — roughly 25,000 "patients" from 2021 are being set against approximately 285,000 from 2022. Stronger conclusions should wait until data from the second half of 2022 is published. That said, the apparent growth in the relative share of category 5 "patients" is consistent with the expansion of the dried flower market observed since 2020.
During H1 2022, at least 47% of "patients" were treated by an AP holding HREC endorsement, which suggests the surge in AP data since November 2021 is not being driven solely by APs prescribing high-CBD and balanced oil and capsule products with an "established history of use."
Comparing AP data to SAS-B data
Both AP and SAS-B datasets have significant flaws, but because those flaws are broadly similar, comparing the two can still shed light on overall trends in patient access. Since November 2021, SAS-B approvals have been patient-, category-, and format-specific, much like AP data — though one key difference remains.
Say Susan visits Dr Carter in January 2022, but Dr Carter is using the SAS-B pathway rather than her AP authorisation. To keep things simple, Dr Carter prescribes Susan only one product: a category 1 oil. In the SAS-B data, this appears as a single approval in January 2022. Susan returns every four weeks, and Dr Carter keeps renewing the same prescription.
SAS-B approvals are valid for two years by default. So despite Susan actively using a medicinal cannabis product and seeing her doctor regularly, she would appear in the SAS-B data as just one approval until January 2024, when renewal would be required — unless Dr Carter prescribed a new product from a different category or format, triggering a fresh SAS-B approval.
If Dr Carter were an AP instead, Susan would show up as a "new patient" in the first six-month reporting period and as a "total patient" in each subsequent one. Over two years, rather than generating one SAS-B approval, she would appear four times in the AP data.
One might assume this means a single SAS-B approval is always equivalent to four AP "patients." But consider a scenario where Susan only visited Dr Carter once and never filled the prescription. In AP data, she would appear once as a "new patient" and then disappear. In SAS-B data, she would appear as a single approval in January 2022. Treating that approval as equivalent to four AP "patients" would be a significant overcount.
On balance, a single SAS-B approval — which can represent up to two years of continuous treatment — is probably "worth" more than one AP "patient" on average. Exactly how much more is difficult to determine.
There is also the complicating factor of the November 2021 reforms, which reduced the number of SAS-B approvals or AP "patients" required to support the same level of access — meaning post-reform figures should in theory carry greater weight. At the same time, as the market has matured, patients being prescribed multiple products simultaneously appears to have become more common, which would pull in the other direction by diluting the value of each individual approval or "patient" count. Neither effect can be precisely quantified, and any conclusion here is speculative.
With those caveats in mind, a conservative approach to measuring the growth in patient access over time — combining both SAS-B and AP data — might rest on the following assumptions:
- One SAS-B approval is worth three AP "patients"
- If new AP "patients" exceeds total AP "patients" in a six-month period, take the smaller number
- The value of SAS-B approvals or AP "patients" has remained constant over time
- Sum all SAS-B approvals issued in a six-month period to allow comparison to AP data
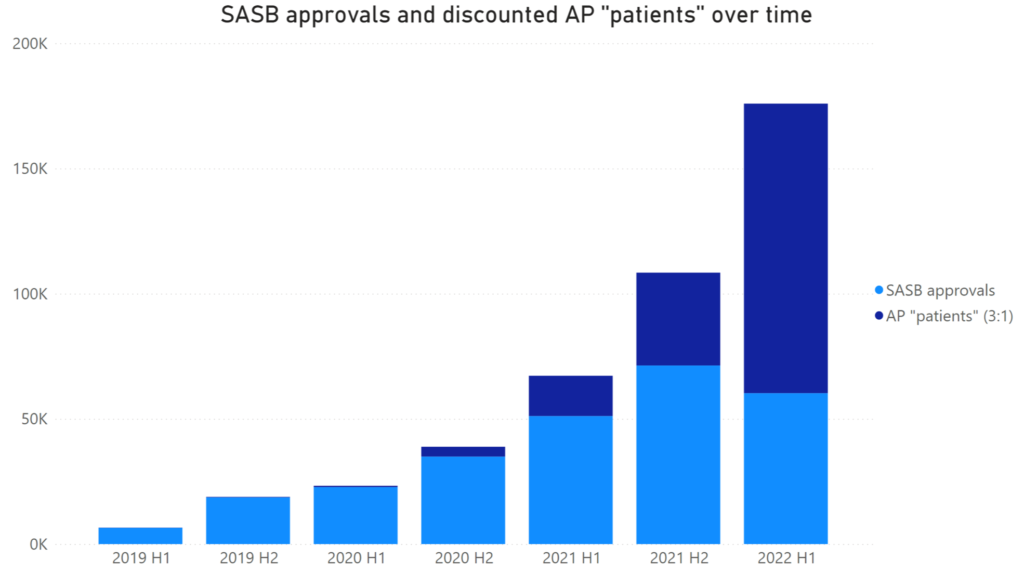
This analysis could be significantly wrong in either direction, and it still cannot tell us how many actual patients exist or how much cannabis is being consumed. Yet regardless of how the data is sliced or what assumptions are applied, one conclusion holds: Australia's medicinal cannabis industry is growing rapidly.